July 28, 2023 – By Gary Isenberg, Senior Vice President – Owner Representation
Download a PDF version of Hospitality Industry Insights – The Pandemic and The Hospitality Industry: From Impact to Recovery
The COVID-19 pandemic has had a profound impact on the hospitality industry, leading to significant disruptions and ongoing challenges. This article delves into the recovery of the hospitality industry, with a specific focus on the impact of the pandemic on labor costs and profitability within three segments: Luxury, Full-Service, and Select-Service. By analyzing STR reporting, we examine occupancy, ADR, and RevPAR across different chain scales within these segments. Furthermore, we utilize HotStats data to shed light on the crucial role of labor and its influence on profitability while highlighting challenges faced during the pandemic and the continuing recovery.
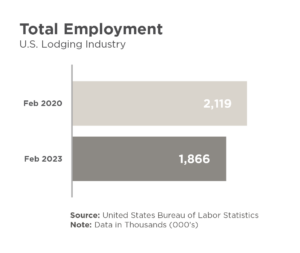
Just before the COVID outbreak in March of 2020, the U.S. lodging industry employed 2.1 million Americans making an average of $18.70 per hour. According to data from STR over the trailing twelve month (“T-12”) period preceding COVID, hotel occupancy then hovered at 65.8% with an ADR of $131.63, yielding $86.67 in RevPAR. The severe blow the pandemic dealt to the industry caused lodging sector employment to plummet to 1.08 million by May 2020, a staggering 50% decline from pre-pandemic levels! CoStar’s T-12 data reveals that the industry hit its lowest point in February 2021, with an occupancy rate of 41.1%, ADR of $95.32, and RevPAR of $39.16. This represented a 55% decrease in RevPAR compared to the pre-pandemic period.
Two years later, by February 2023, the industry had made meaningful progress in its recovery, employing 1.866 million Americans, albeit still down by 254,000 jobs, or 12% from pre-lock-down levels. February 2023 T-12 figures indicate that the industry’s revenues are finally approaching pre-pandemic levels. National occupancy across all chain scales stands at 63.3%, while ADR has reached $151.13, resulting in an overall RevPAR of $95.32. It is important to note that room inventories across all chain scales also grew by 2.1% from February 2020 to February 2023. Although occupancy has not fully recovered, ADR and RevPAR have surpassed the February 2020 T-12 levels by 14.8% and 10.3%, respectively. This is evidence that RevPAR has recovered to pre-pandemic levels thanks to the industry’s remarkable ability to drive higher ADR.
Topline: Luxury Segment
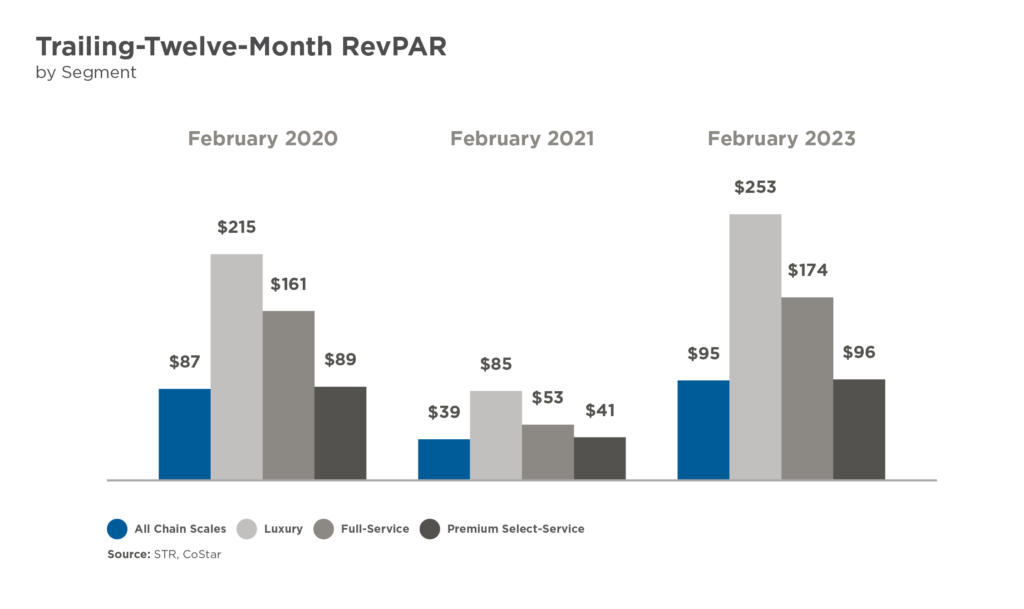
The Luxury segment of the hospitality industry faced significant challenges during the first twelve months of the pandemic. It experienced a decline in occupancy of 41.6 percentage points from the February 2020 T-12, representing a 57% decrease in occupied rooms. Additionally, ADR dropped by 8.4% during the same period, resulting in a RevPAR deficit of 60.6% in February 2021 compared to the prior period.
However, the Luxury sector began to quickly recover after hitting its lowest point in February 2021. As of February 2023, it had surpassed pre-pandemic T-12 RevPAR levels by 17.4%. This growth in RevPAR is attributed to the sector’s ability to capitalize on demand and drive ADR, which has increased by 28.6% over pre-pandemic levels. Although Luxury occupancy still lags by 8.8%, substantial ADR growth has propelled its T-12 RevPAR to $252.65 as of February 2023, surpassing pre-pandemic levels. This sector has vastly outpaced the industry’s overall RevPAR improvement of 10.3% for the same period and has also shown a stronger recovery than the Full-Service and Select-Service segments.
Full-Service Segment
Full-Service hotels were the hardest hit during the first year of the pandemic. In February 2021, the Full-Service segment’s T-12 RevPAR dropped to $52.85, a whopping 67% decline from the pre-pandemic T-12 of $160.71. Occupancy also declined by 60.6 points, while ADR fell by 16.5%. This segment faced the greatest impact during the initial twelve months of the pandemic and was expected to be the last to recover given the lack of Group and Corporate travel. While Leisure travel began to resume in late 2020, Group travel only started to return in earnest in 2022. Corporate travel has not yet reached pre-pandemic levels, and it is believed that it may never fully recover due to permanent changes in business conduct caused by the pandemic.
Although the Full-Service occupancy still lags by 6.5 percentage points or 9% compared to pre-pandemic levels, T-12 RevPAR reached $174.02 in February 2023, an 8.3% improvement over pre-pandemic levels. The resurgence of Group demand in 2022 allowed the Full-Service segment to drive ADR nearly 20% higher than pre-COVID levels, outpacing the February 2020 T-12 mark by $13.31 or 8.3%. The combination of Group demand, surges in Leisure demand, and the emergence of “Bleisure” has enabled this sector to exceed pre-pandemic RevPAR levels. Bleisure refers to the blending of work and pleasure, popular among hybrid- and remote-working professionals who combine business trips with leisure time.
Select-Service Segment
The Select-Service segment experienced the smallest decline during the first twelve months of the pandemic, although a significant impact was still felt. In February 2021, this segment saw a RevPAR decline of 53.8%, a 28.2 point or 40.5% decrease in occupancy, and a 22.5% decrease in ADR. These declines were comparatively lower than those of the Luxury and Full-Service segments. For instance, the Full-Service segment had a RevPAR decline of 67%, or $107.86, while the Select-Service segment experienced a drop of 53.8%, or $47.78. The dollar decline in Full-Service RevPAR was greater than the pre-COVID RevPAR amount of $88.88 for Select-Service!
Initially, the Select-Service segment was expected to recover faster than the other segments due to its lower dependency on Group travel. Corporate travel was expected to slowly resume and large-scale gatherings were anticipated to lag behind. However, the recovery for Select-Service has been slower than anticipated. As of February 2023, T-12 RevPAR had improved by only $6.79, or 7.6%. While occupancy is still 2.6% below pre-pandemic levels, ADR has grown by 11.8%. As Corporate demand continues to improve, Select-Service occupancy, ADR, and RevPAR are also expected to progress.
Overall, the Luxury segment has shown the fastest recovery, easily surpassing February 2020 T-12 RevPAR levels. The Full-Service segment has made significant strides in driving ADR through Group demand and Leisure travel, exceeding pre-pandemic RevPAR levels. While impacted to a lesser extent, the Select-Service segment is experiencing a slower recovery but holds potential for growth as corporate demand increases. The performance comparison of these three segments provides insights into challenges and the subsequent recovery of the hospitality industry.
Average hourly wages across the lodging sector increased from $18.70 in February 2020 to $23.40 in February 2023. This growth of 25.1% reflects the industry’s efforts to attract and retain talent amidst a challenged labor market. It is essential to consider the impact that increased labor costs had on the industry’s overall profitability. In the following sections we analyze the recovery of the hotel industry’s profitability since the pandemic, and the impact labor has had on that profitability. To evaluate the industry’s profitability, we utilized data provided by Hotstats, which provides P&L benchmarking data to hotels, covering 1.2 million rooms in 600 markets across 120 hotel brands. Again, we analyzed data from three segments: Luxury, Full-Service, and Select-Service. For each segment, we reviewed GOP per available room, GOP margins as percentage of gross revenues, and payroll as percentage of gross revenues.
GOP Analysis
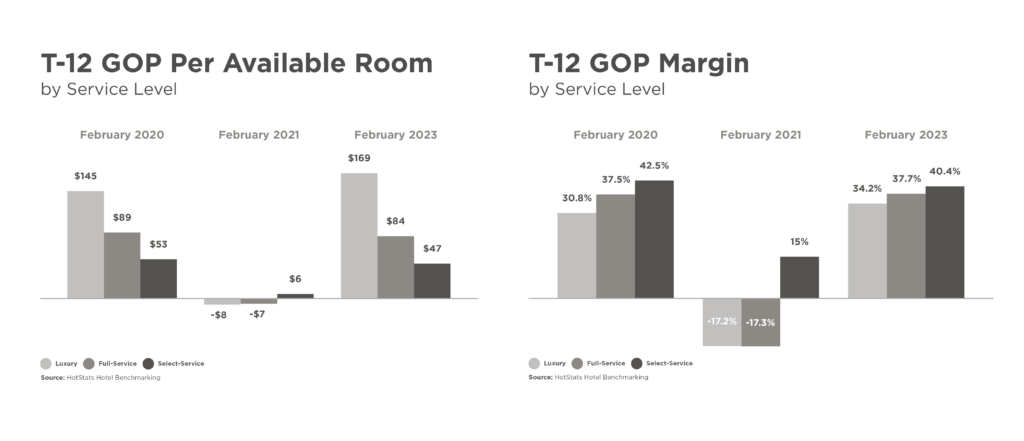
During the first twelve months of the pandemic, Luxury and Full-Service hotels experienced significant losses in GOP per available room, with deficits of $7.55 and $7.46, respectively. Select-Service hotels were able to retain a positive number, recording $5.65. These losses ranged from 89.4% to 108.4% compared to the February 2020 T-12 period. However, as of February 2023, Luxury hotels had shown significant recovery, surpassing pre-pandemic levels by $24.01, or 16.6%. Full-Service and Select-Service hotels were still recovering, lagging behind pre-pandemic GOP per available room by 5.7% and 11.5%, respectively.
All three hotel sectors experienced GOP margin declines during the first year of the pandemic, with Luxury declining 155.8%, Full-Service declining by 146.1%, and Select-Service declining 64.7%. However, as of February 2023, Luxury and Full-Service hotels were operating at higher profit margins than before the pandemic. Luxury exceeded pre-pandemic GOP margins by 11% and Full-Service slightly surpassed by 0.5%. Select-Service profit margins still lagged by nearly 5% compared to the pre-pandemic period.
In terms of profitability, the Luxury sector has surpassed pre-pandemic levels in both GOP per available room and GOP margins. Full-Service hotels still trail pre-pandemic levels but have generated better profit margins. Select-Service profitability is still in recovery mode.
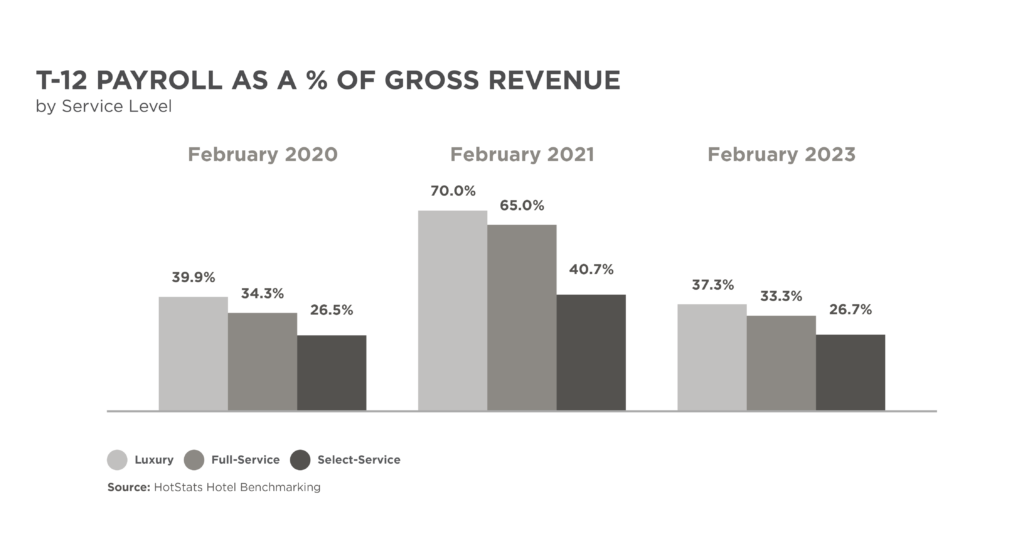
In terms of payroll expense as a percentage of gross revenues, all three hotel segments saw increased costs during the first twelve months of the pandemic. However, as of February 2023, Luxury and Select-Service hotels had improved their payroll margins, with Luxury improving by 2.6 percentage points, or 6.5%, and Select-Service improving by 1 percentage point, or 3.0%, compared to pre-pandemic levels. Full-Service hotels saw a slight increase from 34.3% to 37.3%, while Select-Service hotels had a minor increase from 26.5% to 26.7%.
Based on HotStats data, Luxury and Full-Service hotels managed to grow their revenues during the recovery period through ADR at a faster pace than increases in wage costs. This resulted a lower payroll percentage of gross revenues compared to pre-pandemic levels. Ironically, Select-Service hotels experienced payroll costs that outpaced revenue growth during the recovery.
Although the industry’s COVID-19 recovery is still ongoing, when it comes to labor cost margins, the Luxury hotel segment has enjoyed the largest improvement relative to both the mid-pandemic trough and pre-pandemic levels.
Conclusion
The overall financial impact on the hospitality industry during the pandemic and the subsequent recovery period has been significant. While the recovery continues, challenges persist for hotels across segments. The Luxury segment has led the recovery, displaying notable improvements across the board in RevPAR, GOP per available room, GOP margin, and payroll as a percentage of revenue in the trailing twelve months ended February 2023. Full-Service hotels have made decent progress in RevPAR and GOP margin, though the GOP per available room shows room for improvement. Payroll, despite elevated wages, is a lower percentage of gross revenue than pre-pandemic, indicating that thoughtful cost management strategies focused on other departmental and undistributed expenses could bridge the gap. Select-Service hotels lag the other two service levels across the board in flowthrough and profitability. Despite increased RevPAR, they have yet to experience a full recovery in the other three metrics measured in this analysis.
Overall, the impact of labor costs on the hospitality industry during the pandemic and the subsequent recovery period cannot be understated as operators strive to attract and retain talent. It has forever shaped the operational landscape, profitability, and strategies employed by hotels across different segments. As the industry continues to recuperate, the balance between managing labor costs and providing exceptional guest experiences will be vital to long-term sustainability and success. Implementing aggressive cost management strategies, optimizing operational efficiency, and adopting innovative solutions will be crucial for the hospitality industry to successfully navigate its continuing recovery.
Speak with one of our Owner Representation specialists to explore opportunities to enhance the value of your hospitality asset, or if The Plasencia Group may be of other assistance at any point throughout the entire life-cycle of your hotels or resorts, please call us directly at (813) 932-1234.
Footnote: The data used in this analysis is based on industry data from STR and CoStar, as well as HotStats’ profit benchmarking, which provide valuable insights into the industry’s performance. However, it is worth noting that individual hotel properties and markets may have experienced variations in their specific circumstances and outcomes.
For more valuable hospitality industry news and market analysis from The Plasencia Group, be sure to opt-in to our news and communications list.